Stop Chasing.
Start Following Rules.
Replace random entries with a structured process for identifying, planning, and managing trades.

Common Traps vs The OTD Framework
Most trading drawdowns stem from emotional revenge entries and lack of execution boundaries.
Impulsive Entries (FOMO)
Entering mid-candle on fast market moves without waiting for mathematical confirmation or closed price bars.
Strict Setup Conditions
Act only when the 3-zone color ribbon shifts, RSI momentum aligns, and pullback rejection closes above key benchmarks.
Overtrading & Revenge Trading
Taking 8-15 discretionary trades per session to recover a morning loss, compounding transaction taxes and stress.
One Planned Trade Maximum
Session terminates strictly after 1 planned trade. Win or loss, close the terminal and step away.
Inconsistent Position Sizing
Guessing lot sizes and placing market orders before defining the maximum acceptable rupee drawdown.
Pre-Defined Mathematical Risk
Stop-loss level and position size are computed prior to order placement to enforce uniform risk per trade.
Ill-Defined Exit Strategy
Cutting small gains prematurely out of anxiety while letting losing trades breach risk limits.
Dynamic Trailing Stops
Follow real-time trailing SL benchmarks. Lock in accrued points systematically while letting trend extensions run.
Screen Burnout (9:15 - 3:30)
Staring at 1-minute ticks all day, resulting in mental exhaustion, erratic executions, and choppy afternoon traps.
Focused 9:20 – 12:00 Window
Trade only high-liquidity morning institutional volume. Avoid midday chop and log your post-session review.
* Educational contrast illustrating risk management principles. Individual execution outcomes vary based on market conditions.
The 5-Step Execution Workflow
A linear, non-discretionary execution sequence followed for every trading session.
Find the Setup
Protocol Phase: Indicator ScanUse the indicator and defined conditions to identify a possible setup.
- Observe 5-minute index chart for trend ribbon transition
- Confirm price is inside high-conviction Green or Red zone
- Look for rejection arrows near trailing stop ribbon
Find the Setup
Use the indicator and defined conditions to identify a possible setup.
Analyse
Check the setup against the chosen rules and market context.
Plan Your Trade
Define entry, stop-loss, position risk, and exit conditions.
Execute
Act only when the rules are satisfied.
Stop & Review
Respect the one-trade limit and review the process.
Actual Chart Interface Walkthrough
Real historical TradingView captures illustrating the FFI Trend Rider Pro visual spectrum across Long, Short, and Pullback phases.
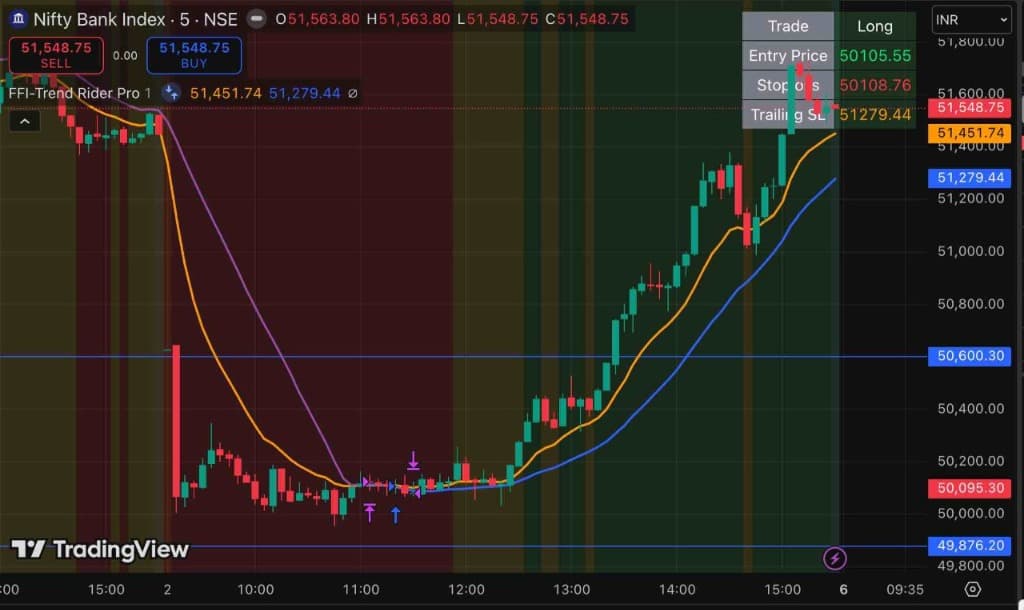
Nifty Bank Index
LongHeavy morning distribution trapped short sellers in the Red zone. Between 11:00 AM and 12:30 PM, price formed a base inside the Yellow No-Trade zone. Once the dynamic ribbon confirmed a bullish crossover and shifted to Green, the indicator registered the Long entry at 50,105.55. Dynamic trailing stop tracked up to 51,279.44 to protect gains.
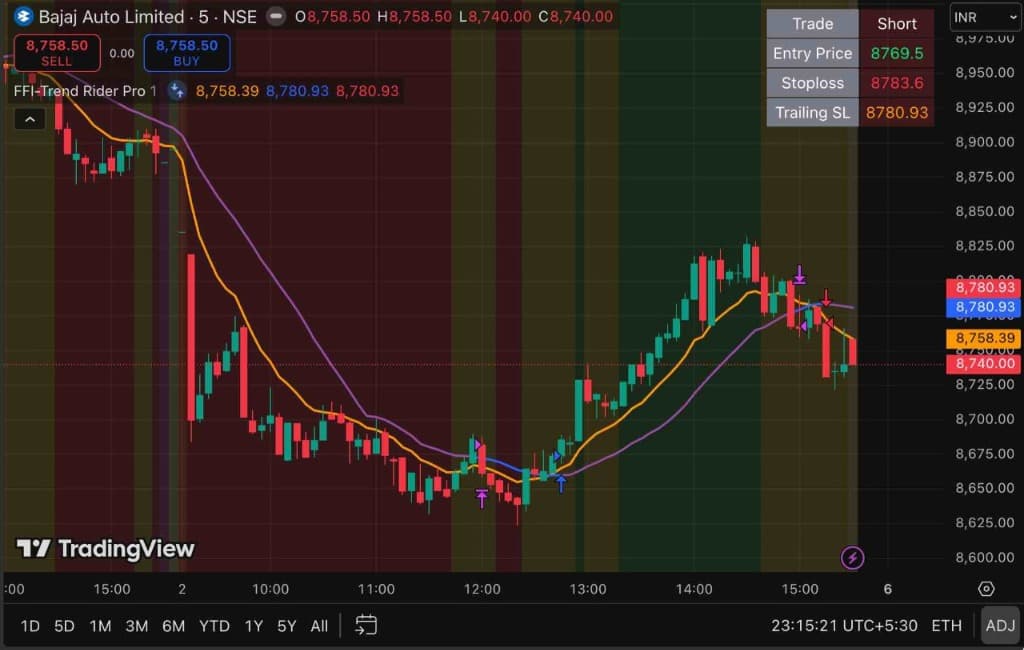
Bajaj Auto Limited
ShortFollowing morning breakdown, the stock traded beneath the orange/blue trend ribbon in the Red Selling Zone. Retests toward the ribbon were systematically rejected with downward micro-trend arrows. The HUD registered the Short entry at 8,769.50 with a tight stoploss at 8,783.60.
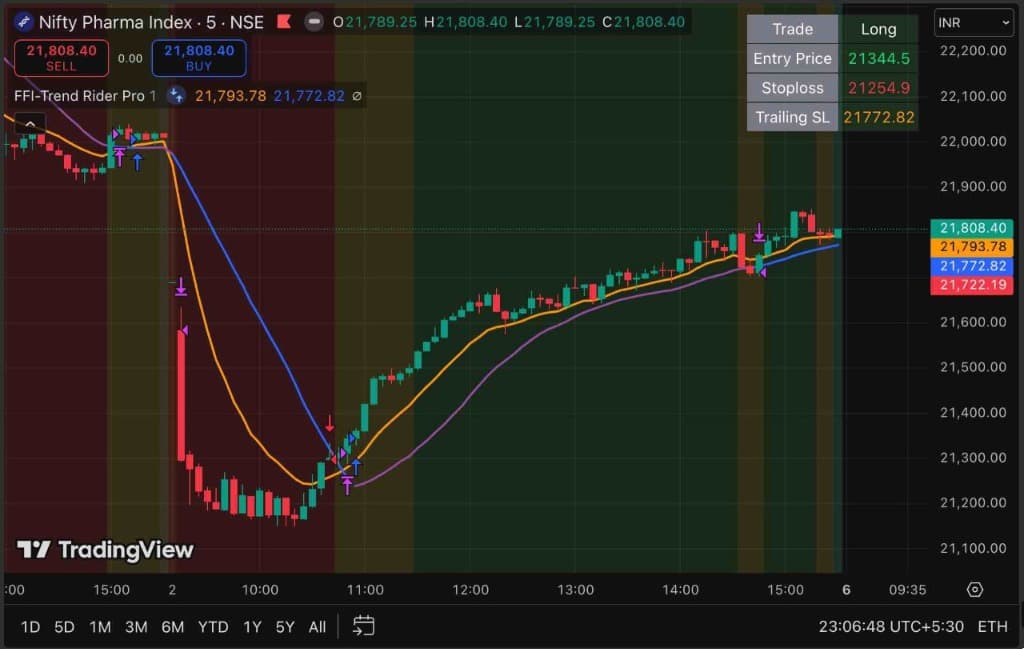
Nifty Pharma Index
LongIllustrates why the Yellow 'No-Trade' zone is crucial to capital preservation. Following an initial opening selloff, the OTD framework enforced waiting for 90 minutes while the market chopped inside the Yellow zone. Support confirmation triggered the Long entry at 21,344.50 followed by a multi-hour trend extension.
Interface Evidence: Captures shown from TradingView to illustrate indicator annotations, zone color shifting, and trailing SL behavior—not guarantees of future returns.
FFI Trend Rider Pro Specifications
Replaces clustered lagging oscillators with an integrated 3-zone visual spectrum and automated risk benchmarks on TradingView.
Dynamic 3-Zone Spectrum
Instant visual clarity on TradingView. The chart background dynamically renders three distinct behavioral market regimes:
- Green Zone: High-probability buying territory with institutional volume expansion
- Red Zone: Breakdown regime trading below key dynamic trend ribbons
- Yellow Zone: No-trade consolidation zone—filters out lethal midday chop
Micro-Trend Shift Triggers
Micro-trend reversal arrows appear when price rejects the dynamic ribbon with volume momentum alignment.
- Purple/Blue micro arrows pinpoint pullback exhaustion points
- Eliminates chasing after large extended impulse candles
- Requires multi-bar price action confirmation before trigger validation
Built-In RSI Momentum Filter
Prevents entering overextended exhaustions. Signals validate only when relative strength confirms momentum headroom.
- Rejects false breakouts in overbought / oversold extremes
- Integrated directly into main chart pane—no secondary clutter
- Calibrated specifically for fast 5-minute index volatility
Automated HUD Risk Benchmarks
Directly on your TradingView chart, the proprietary HUD overlay calculates mathematical references:
- Calculates exact numerical Entry Price upon candle close
- Displays predetermined Stop-Loss to cap risk immediately
- Updates active Trailing SL line to systematically protect accrued points
TradingView Native Integration
Engineered natively for TradingView (runs on both Free and Paid TradingView plans via private script invite).
- Lightweight Pine Script architecture with zero chart lag
- Seamless execution with Dhan via tv.dhan.co chart order placement
- Works across NSE Index Futures, Equities, and liquid Commodities
Tool vs Framework Separation
A clear operational distinction between the indicator software and the trader's behavioral rules.
- FFI Trend Rider Pro: The analytical TradingView charting indicator
- OTD System: The strict 1-trade-per-day psychological risk framework
- Software provides data; the OTD protocol provides the discipline to execute
* FFI Trend Rider Pro is an invite-only script for TradingView. Works on Free, Essential, Plus, and Premium TradingView accounts.

Trade the OTD Framework Directly from TradingView Charts
Dhan offers direct chart trading on tv.dhan.co. Place bracket orders, set pre-defined stop-losses, and track your trailing SL right on the 5-minute index chart without switching between tabs.
The 4 Foundational OTD Rules
The indicator generates signals; these four non-negotiable boundaries govern capital survival.
Maximum One Trade Per Day
The core constraint of the framework. Win or loss, the trading session terminates immediately upon position close. Zero revenge trading, zero dopamine chasing, and zero account overexposure.
5-Minute Chart Workflow
All setups are identified, planned, and confirmed strictly on 5-minute candlestick charts. Filters out random 1-minute noise while providing responsive entries ahead of 15m/1h lag.
Session Window: 9:20 AM – 12:00 PM IST
We trade only during high-volume institutional liquidity hours. Skip the opening 5-minute volatility trap (9:15 - 9:20 AM). After 12:00 PM IST, European pre-market drift often causes choppy chop.
Minimum Planned Risk/Reward Reference: 1:3
Never enter a trade unless the distance to the opposing liquidity benchmark offers at least 3x the distance of your stop-loss. If risk is 30 points on Bank Nifty, potential target must be 90+ points.
These parameters represent a disciplined framework model. Live trading outcomes depend on broker slippage, exchange turnover charges, GST, STT, and your personal adherence to stop-loss levels.
Transparent Pricing
Direct TradingView invite access to FFI Trend Rider Pro and the complete OTD execution rule framework. No hidden charges.
Monthly Plan
Flexible monthly access
Billed monthly. Cancel anytime before renewal.
- FFI Trend Rider Pro script access on TradingView
- Dynamic 3-Zone trend filter (Green / Red / Yellow)
- Built-in RSI momentum confirmation filter
- Real-time Entry, Stop-Loss & Trailing Stop guidelines
- Standard 5-minute intraday framework setup guide
- Community trade review channel (Discord/Telegram)Pre-Launch
- Monthly live Q&A session with FFI mentorsPre-Launch
Secure checkout via payment gateway
Yearly Plan
Annual Commitment
Yearly plan costs ₹17,500, saving you ₹12,488 annually.
- Full 12-month access to FFI Trend Rider Pro indicator
- Dynamic 3-Zone trend filter (Green / Red / Yellow)
- Built-in RSI momentum filter & micro-trend signals
- Complete OTD One-Trade-A-Day SOP blueprint
- Priority TradingView invite activation within 2 hours
- Yearly plan saves ₹12,488 vs paying ₹2,499/mo for 12 months
- Quarterly algorithmic rule updates & parameter tuningPre-Launch
- Direct mentor chat desk for process reviewPre-Launch
Priority TradingView username invite activation
Learn the OTD System Live
Explore the workflow, understand the rules, and see how to evaluate indicator signals before deciding whether the system is right for you.
Live Demonstration
Real-time walkthrough of FFI Trend Rider Pro on live Nifty and Bank Nifty 5-minute charts.
Trading Rules Overview
How to enforce the 1-trade maximum, calculate exact lot size, and honor stop-loss rules without emotion.
Chart Walkthrough
Step-by-step review of historical Long, Short, and Pullback setups with clear invalidation criteria.
Questions & Answers
Direct open-mic session with FFI mentors to address your questions.
Common Questions
Direct, candid answers regarding the OTD framework, platform compatibility, and expectations.
The OTD (One Trade a Day) System is a disciplined trading framework developed by Financial Freedom Institute (FFI). It combines a structured 5-step execution workflow with the proprietary FFI Trend Rider Pro indicator on TradingView. Its core goal is to eliminate impulsive overtrading by enforcing exactly one planned trade per day, pre-defining mathematical risk, and trading only during the morning institutional window (9:20 AM – 12:00 PM IST).
Have a question not listed here or need guidance before subscribing?
Direct mentor desk: support@ffi.org.in
Mandatory Regulatory & Capital Risk Disclosure
Indian Securities & Derivatives Trading Notice (SEBI Mandated Context)
Based on empirical research published by the Securities and Exchange Board of India (SEBI):
- 9 out of 10 individual traders in the equity Futures & Options segment incurred net losses over analyzed periods.
- Loss makers registered an average net trading loss of approximately ₹50,000 per trader.
- In addition to net trading losses, active traders expended an additional 15% to 28% of their net loss value in brokerages, exchange transaction fees, and taxes.
All materials, webinars, indicator scripts, and chart walkthroughs provided by Financial Freedom Institute (FFI) are strictly for educational and workflow training purposes. We are not SEBI-registered Research Analysts (RA) or Investment Advisers (RIA).
Indicators and technical tools analyze historical price action and mathematical momentum. They cannot predict future geopolitical events, sudden black-swan shocks, or eliminate trading losses. Past results and screenshot examples do not guarantee future profitability.